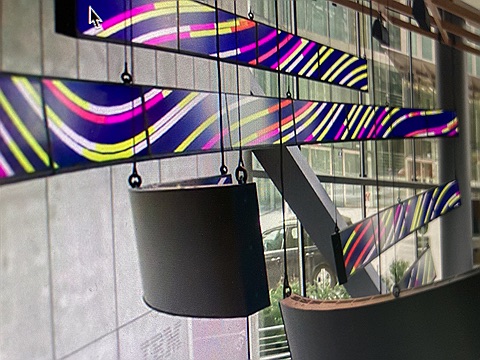
Breaking Wave
Breaking Wave is an anamorphic kinetic sculpture created for Biogen-Idec's new headquarters in Cambridge, MA.

In dieser Session gibt es einen kurzen thematischen Rundflug über das Themenfeld, sowie die Kursinhalte und -ziele. Wir schauen uns eine inspirierende Projekte an und kümmern uns um sinnvolle technische Setups.
mehr Ermutigung/ positives Feedback 👻
Zur Vorbereitung gibt es auf der Startseite des Kurses ensprechende Hinweise. Die Kompetenzen aus Coding Essentials sollten sitzen. Wir werden in diesem Kurs auf folgende Inhalte zurück greifen:
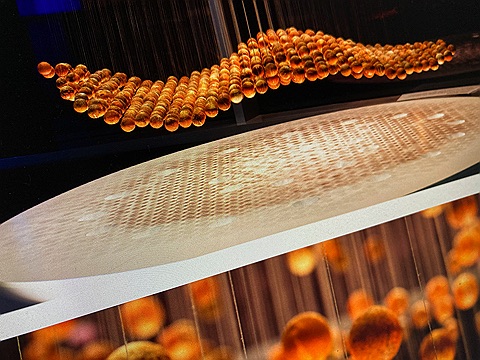
Breaking Wave is an anamorphic kinetic sculpture created for Biogen-Idec's new headquarters in Cambridge, MA.
Data Artist and Designer
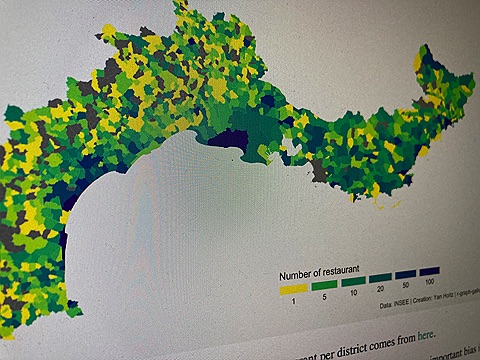
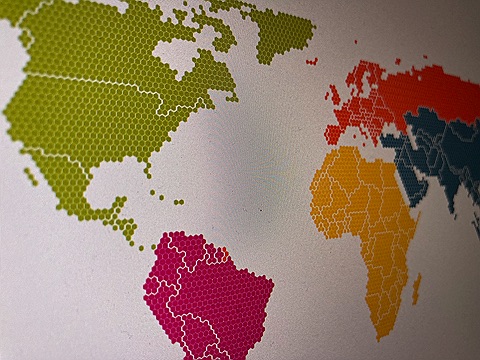
A choropleth map displays divided geographical areas or regions that are coloured in relation to a numeric variable.
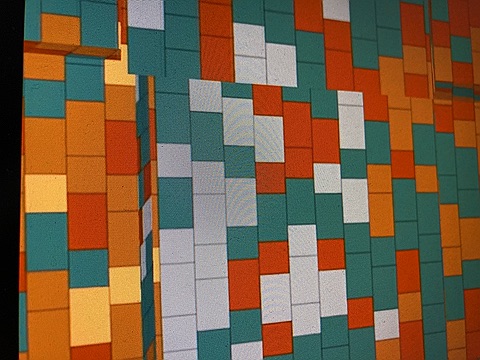
Interactive parametric design and simulation environment for tile patterns.
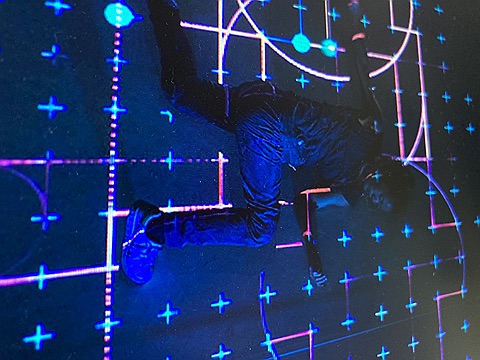
Collide is an exploration of the senses by transforming recorded motion data into abstract visuals and sound.
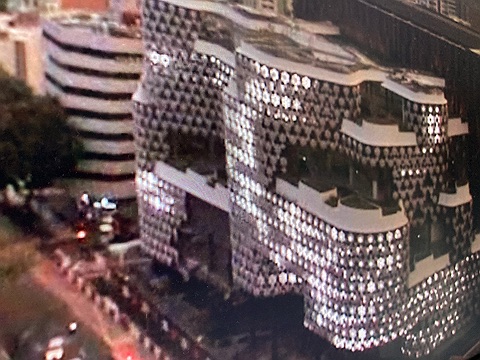
Crystal Mesh is a façade for the building complex “ILUMA” in Singapore.
This abstract data illustration highlights the store’s communication by visualizing the interaction of users online.
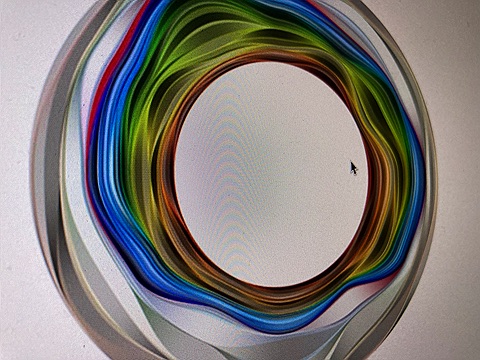
Flickr Flow is an experiment whose materials are color and time.
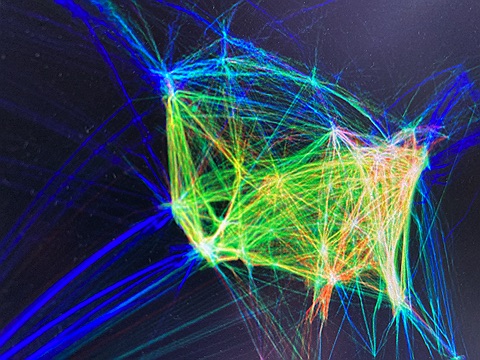
Flight Patterns is a time-lapse animation that employs data visualization and processing, an open-source computer programming environment, in order to display American air-traffic patterns and densities over a twenty-four-hour period.
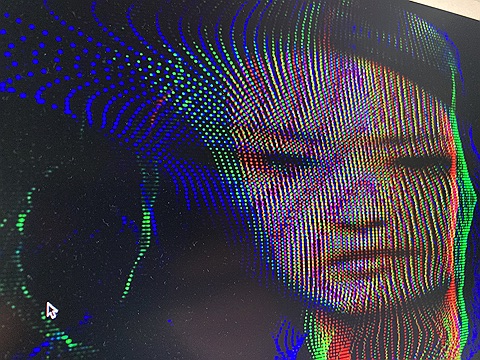
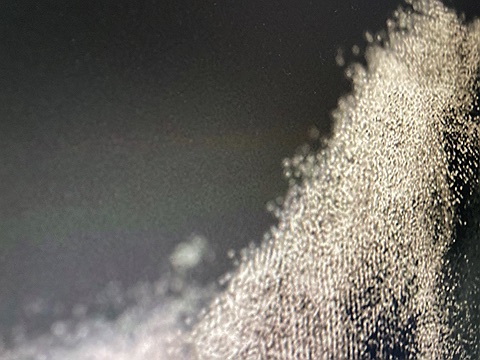
An exploration of human perception through engagement, distortion and dissolution.
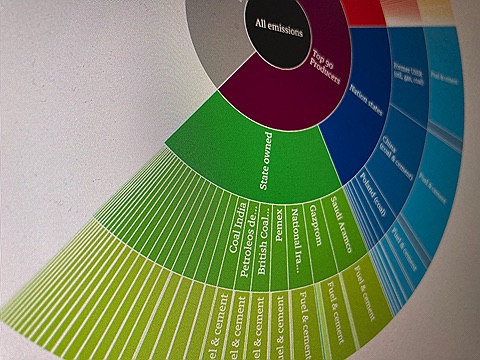
Data Visualization that shows which companies extracted the carbon-based fuels that have caused climate change.
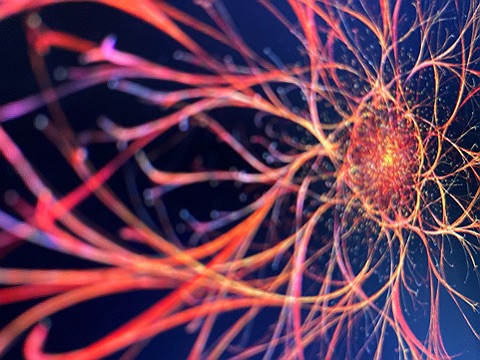
FLUX is a data-driven art installation visualizing the different facets of the Internet of Things and cognitive technologies.
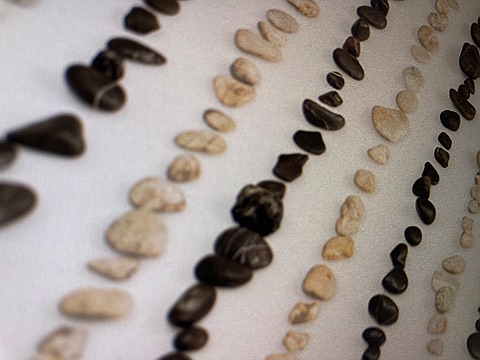
Jller is part of an ongoing research project in the fields of industrial automation and historical geology.
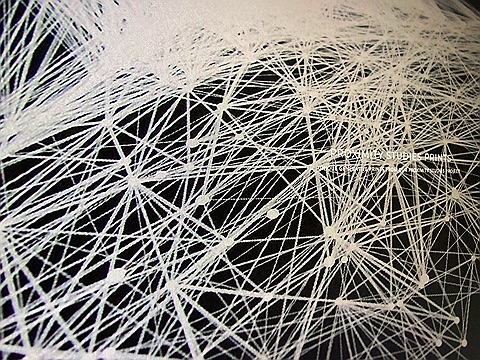
Kirell Benzi is a data artist, science communicator and researcher.
Kultur Design is a creative agency specialising in data visualisation, information design, web applications & generative design.
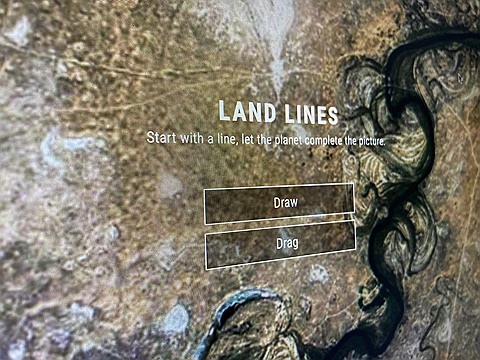
Land Lines is an experiment that lets you explore Google Earth satellite imagery through gesture. “Draw” to find satellite images that match your every line; “Drag” to create an infinite line of connected rivers, highways and coastlines.
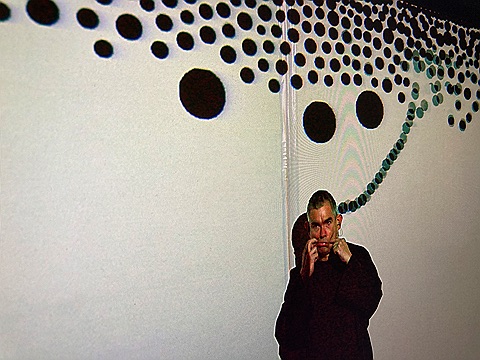
Messa di Voce augments the speech, shouts and songs produced by two virtuoso vocalists with real-time interactive visualizations.
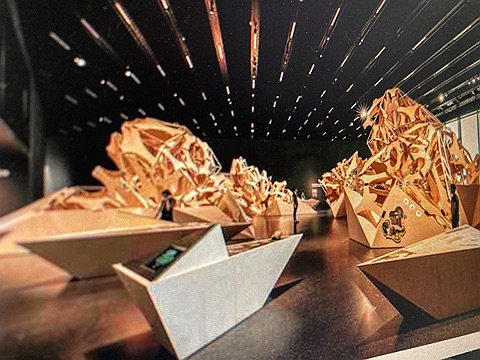
Tipp für den nächsten Berlin-Trip – das sehenswerte Ausstellungsdesign von ART+COM fürs Futurium.
Pathfinder is a generative approach for the conceptual choreographic research of body movements.
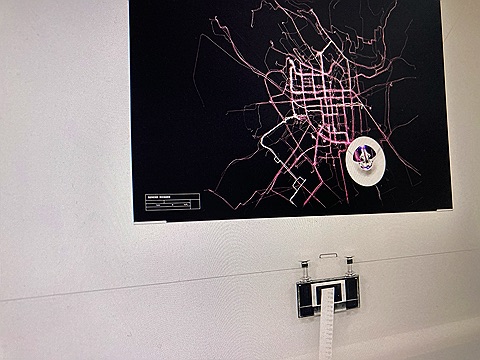
Die Radwende-App zeichnet die gefahrenen Strecken der Nutzer auf, bündelt diese und visualisiert sie in einer digitalen Karte.

Die Konferenz zur Visualisierung von Informationen. Erkenntnisgewinn durch Veranschaulichung.
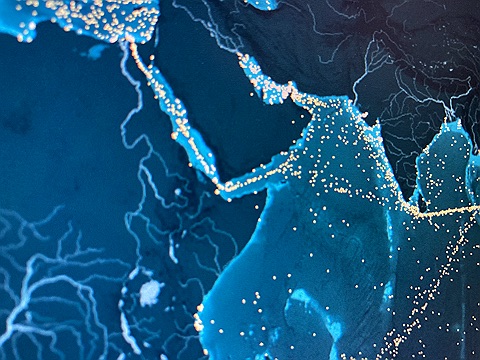
The Data Visualization shows the movements of the global merchant fleet over the course of 2012, overlaid on a bathymetric map. You can also see a few statistics such as a counter for emitted CO2 and maximum freight carried by represented vessels.
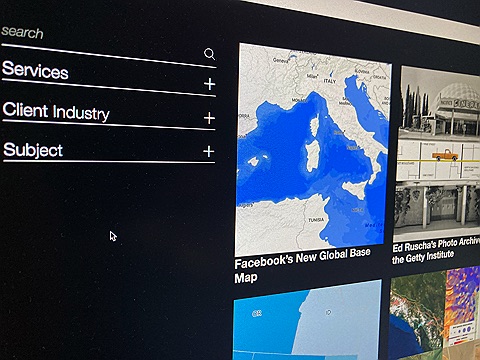
Stamen is a data visualization and cartography design studio, based in the Mission District of San Francisco and founded by Eric Rodenbeck in 2001.
The moving sound sculpture is based on the recorded motion data of a real person.
Who saves the least for old age, who borrows the most from family and which country does the most online shopping?